Acoustic Emission is a passive testing technique that can detect the damage mechanisms of carbon fibre structures whilst under load. This technique will be shown in this paper to provide useful feed back to the designer to hone his design during the testing stage.
Download a PDF version of this paper
Authors:
Chris Rowland Pancom, Huntingdon, UK
Lewis Butler Arrows F1, Leafield, UK
Mark Preston Arrows F1, Leafield, UK
26th European Conference on Acoustic Emission Testing – 2004 – Berlin (Germany)
Abstract
One of the important features of the racing car is the power to weight ratio, and to this end, weight has been considerably reduced by the use of carbon fibre in the modern Formula One car. The weight saving obtained from carbon fibre components is utilised by the strategic placement of ballast (since there is a minimum weight limit set by the racing authority, the FIA), ordinarily as low as possible in the car. The placement of the ballast partially controls the position of the Centre of Gravity (CoG) and is the position through which inertial forces act. This is considered a primary performance measure along with the tyres, aerodynamics and engine power in fighting for podium positions. Designers of Formula One cars strive to find the minimum weight for that purpose. Colin Chapman, the legendary car designer, once said that his car only had to make the chequered flag of that race; it should fail immediately after that.
The FIA have stringent technical regulations pertaining to driver safety. Included within these are mandatory testing procedures (which are witnessed) for the safety structures of the car, helping the driver to survive from high impact forces. Also to finish the race without failure, many of the critical components of the car are proof tested between races.
Acoustic Emission is a passive testing technique that can detect the damage mechanisms of carbon fibre structures whilst under load. This technique will be shown in this paper to provide useful feed back to the designer to hone his design during the testing stage. This paper illustrates the use of the Felicity Ratio (FR) as used in the ASTM E1067, “Standard Practise for Acoustic Emission Examination of Fiberglass reinforced Plastic resin (FRP) Tanks and Vessels.”
Introduction
Formula One Teams desire the lightest parts to allow for construction of a vehicle that has the largest possible mass of movable ballast. The vehicle is required to reach a minimum legal mass limit of 600Kg, with no limit on the amount of ballast allowed. This ballast is then placed as low as possible in the car and in the desired positions along the wheelbase. This causes a reduction in centre of gravity height, and therefore a reduction in the difference in vertical wheel loads during cornering is seen. One must now assume that the driver is capable of driving the car at the limit of tyre adhesion at all times. This reduction of so called ‘weight transfer’ across the car from the lower centre of gravity results in a higher grip capability being available for any given tyre. So in real terms this allows for higher cornering speeds, and therefore a reduction in lap time. This is the primary reason (but not the only one) why minimum structural weight leads to a performance enhancement. To that end all structures are designed for minimum weight whilst staying within the constraints applied by any self imposed stiffness targets and the regulations for safety imparted by the sport’s governing body – the Federation Internationale de l’Automobile (FIA). Acoustic Emission equipment can aid in the attainment of the lightest vehicle possible.
Structural Requirements
Certification Tests – assurance of required Driver Safety standards
The FIA applies stringent requirements on the Teams to ensure regulations are both relevant and sufficient to protect the driver from serious injury wherever possible.
[Ref 2002 Formula One World Championship Technical Regulations taken from www.fia.com in that year]
This is achieved using three types of test.
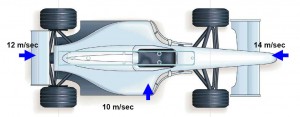
- Impact Tests are carried out at various speeds with an impactor having a mass of 780Kg. There are three Impact Tests in the current regulations, shown on figure 1. All of them employ sacrificial CFRP structures to absorb the energy. The regulations require no permanent (visible) damage in their supporting structures. This is obviously a very subjective requirement. Two of these are applied to the driver safety cell (Front and Side), whilst the Rear test is reacted through the gearbox casing.
- Static Load Tests are applied to the energy absorbing structures to verify their strength normal to the direction of the impact.
- Static Load Tests applied at various predetermined positions on the chassis. These are used both in the certification process and also as a verification tool during the season to ensure that all other chassis’ are of similar weight and stiffness to the chassis that undergoes the impact tests.
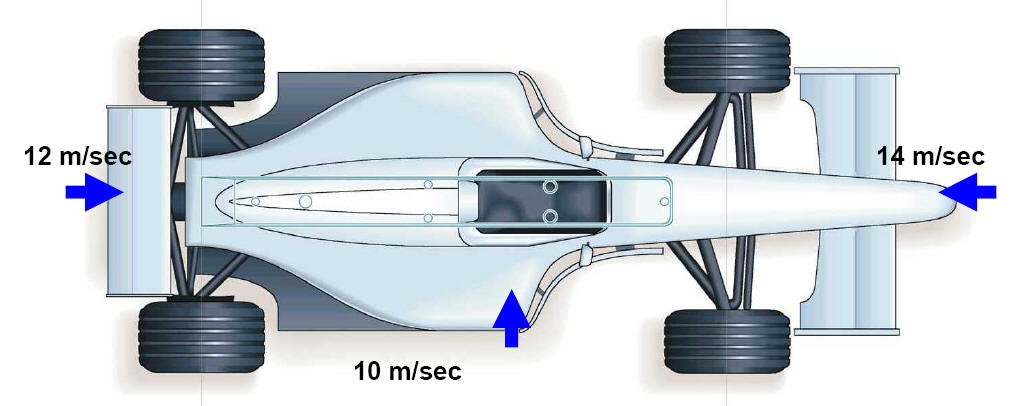
Figure 1 – Plan View of generic Formula One car
On-Track Loading – Quality Assurance of Load Bearing parts
Routine tests are carried out on components to ensure service loads can be sustained. This process is important for a number of reasons, however the primary one is driver safety, because impacts with barriers and other vehicles within Formula One are due to either driver error, or component failure causing loss of driver control. The latter of these is therefore where designers place their effort. It is worthy of note that even with the level of engineering effort that is used to produce a modern car there are still a significant number of component failures in service.
Carbon Fibre Reinforced Plastic (CFRP) – an introduction
CFRP and its associated advancing technologies in both material properties and manufacturing methods have revolutionised the complexity, quality and structural efficiency of many components over the past 20 years. The external form of CFRP components are defined by mould tools. This means complex surfaces are often used, primarily with aerodynamic advantage in mind. CFRP components invariably constitute a number of layers of fabric that can be tailored to give a large range of stiffness and strength in any desired direction that can be altered in distinct areas of any structure. Each layer of material has a given thickness, orientation, and a precise region over which it is to be placed. Manufacturing variables are more significant than for metallic parts. CFRP parts as used in Formula One are manufactured ‘manually’ in a labour intensive process susceptible to human error. These CFRP parts are then ‘cooked’ at given pressure and temperature to cure the resin (which is ordinarily part of the parent fabric). Many assemblies then require the secondary attachment of other parts using adhesive. Chassis’ require this to complete the assembly: at the very least the seat bulkhead, and two main sections are typically joined at this stage.
Structural Design
The initial stage of the vehicle design essentially involves deciding upon how much space, and in which areas it is required to best package all the vehicle systems.
From this some guidance is then required from a combination of: geometry defined by regulations, required space for structures, aerodynamic devices and any other systems.
Aerodynamics is currently the most important factor that decides the form of all external surfaces, and structural efficiency is often compromised as a result. Hand calculation is the primary geometry definition tool open to the designer at an early stage. The definition of loading is done in a variety of ways depending upon the part in question, but methods are invariably based on a combination of experience, logged data and calculations.
Finite Element Analysis (FEA)is widely used in an attempt to optimise structural efficiency of most load-bearing components on a modern Formula One car. This is a process where a mathematical representation of a component is split down into smaller sections (elements), all of which are joined to one another. This allows for the application of loads and constraints that attempt to best represent reality. Stresses and deflections are typically obtained and used to give designers some direction for weight saving or other improvement that can be made in current designs. Material properties and loads are therefore obviously of great importance. Unlike metallic components, CFRP requires more input to the FE model to achieve a workable solution. Modelling capability is not sufficient to give the same level of detail as is possible for metallic parts. The complexity comes from the primary advantage of CFRP – ability to tailor structural properties. Therefore all relevant information requires entry into the FE model before useful results can be obtained. Currently the FE method that best deals with these multi-layered components involves a two-dimensional mathematical shell representation of the mould surface, with the material thickness’ being the third dimension that is dealt with solely within the computation of the software that is used. Material property data also has limitations in many areas when compared to metals. This is because of the non-isotropic nature of the constituent layers of fabric, and also how they interact when used in different combinations. Testing for values of failure stresses, especially in compression, is extremely difficult when attempting to characterise a single layer of fabric. So in summary the following must be borne in mind when using FEA – no model is perfect, some are useful. Therefore a combination of hand calculation and FE model results is normally required to give sufficient levels of confidence to approve a component design. However even this is sometimes insufficient to explore all eventualities, it is in these situations that Acoustic Emission (AE) based tests become invaluable.
Acoustic Emission equipment – how it is used
Specimen Testing
In order to calibrate the failure modes in final testing a database needs to be built, example as shown in table 1. This entails characterisation of material failure modes against AE signal levels and types including inter-laminar, direct fibre failure and resin (matrix) failure. Also some bonded parts should be characterised in shear and peel to obtain some understanding of the energy that is released during a failure.
| Failure Mechanisms | Amplitude (dB) | Peak Energy (eu) | Duration (uS) | Qty |
| Matrix cracking | 40-60 | <500 | Very large | |
| Delamination | 50-70 | 500-1000 | >1000 | Large step |
| Fibre breakage | >85 | >1000 | medium | |
| Glue line peel | 60-70 | 500 | 500 | large |
| Glue line break | >90 | >15000 | low |
Table 1 Failure mechanisms versa AE parameters
Full Scale Structure Tests
Proof Testing and Loads definition are critical to successful Quality Assurance of load bearing components (suspension, wings, chassis). Figure 2 shows a typical purpose proof test rig for down force wings and Figure 11 shows some of the sensors attached to the A23 chassis in an Instron model 5586 testing machine. Some structures that pass proof load tests also occasionally fail on the track, due to lack of understanding of either the true environmental or loading condition. Through use of AE the designer can measure the severity, mode and location of damage during a load test. CFRP can handle a certain amount of load re-distribution due to local failure before it affects the fatigue capability of the structure. Subsequently using AE in proof tests on these parts it can be found that the Felicity Ratio indicates damage far below the proof load and can highlight the possibility of low cycle fatigue. This allows redesigns and evolutions to take place with detailed knowledge of the area of failure and the type of problem(s) encountered.
Complimentary methods of monitoring structural tests include:
Load versus Displacement
This is the simplest and quickest way to monitor a test. The expected stiffness can be defined by analysis and calibrated at the time of the first proof test. Subsequent parts can then be benchmarked to the original.
Strain Gauging
This is used as a secondary tool for detailed strain information in certain areas. It allows for verification of calculated stresses and loads.
Non-destructive Inspection methods
Various empirical methods can be employed. An example is tapping the surface of a laminated component using a coin to listen for noise changes, and this can indicate de-lamination under the surface.
There are some personnel that have enough experience of this type of ‘test’ to give direct feedback of noise level against perceived damage severity. The primary issue is that this is qualitative only, and does not give any significant confidence level of being able to give an informed decision on integrity of the structure.
There is now a more quantitative method along the lines of the above that measures modal frequencies from a small impulse to the surface.
Ultrasonic Testing equipment can also be used to verify laminate thickness given prior knowledge of an undamaged (or the very same) component. This is most effective on uniform surfaces with solid laminates. Therefore at various intervals through a controlled fatigue load test regime one could verify if any significant damage may have occurred that caused a change in the thickness of any areas of the structure indicated by this equipment. The AE results provide a global overview of damage that can subsequently be inspected in more detail using ultrasonic techniques
AE background
The Felicity Ratio (FR) is a way of measuring the level of residual damage put into a structure and can be used as a real time integrity tool in the testing of Formula One CFRP structures. The FR is defined as the measure of severity of previous induced damage and is obtained directly from the ratio of load at the emission source at onset of significant emission and the maximum prior load at the same point. To calculate the FR, first detect the start of AE (point A) on the increasing load and then ratio to the previous maximum load (point B)
i.e. FR = A/B.
| If the FR=1 then the structure is not significantly damaged |
| FR <1 then permanent damage has occurred |
| FR = 0 the structure has reached its ultimate load |
| Mode of failure can be obtained from the slope of curve |
This ratio can be plotted against each previously maximum load (point B) to produce a graph of FR versus load, as in Figure 3 which shows the results of testing seven down force wings reported in Materials World [1]. In this instance the wings were damaged during the production proof test of 800Kg. It was just a matter of time for low cycle fatigue to cause catastrophic failure of the wing, since the working load can peak at 600Kg.
Of the few publications reporting on the use of the FR in industrial applications Hamstad [2] showed that using summation of AE parameters (hits, counts& energy) for the selection of the ‘onset of significant emission’[3] was successful in correlating the FR and the burst pressures for graphic/epoxy vessels. To measure the damage induced during a CFRP hip prosthesis fatigue test, Taylor [4] unloaded the component periodically to measure the FR by a static load test.
With the high attenuation of CFRP materials (up to 100dB/m) hit summation is likely to be more reliable for FR analysis when inter sensor spacing is on its limits. Likewise, if the major failure mechanism is matrix damage, then hit summation should better indicate the onsite of significant emission for FR analysis. With major structure damage involving delamination and fibre breakage, counts and energy summation are better indicators of FR analysis, with suitable inter sensor spacing.
Equipment and Setup
The acoustic emission equipment used was the AMSY4 manufactured by Vallen GmbH and the sensors were Pancom’s model P15 (150kHz) specially designed for composite applications. The equipment settings were as follows:
| Preamplifier | Acquisition | No of Channels | Real time Graphics |
| AEP3 Gain=40dB Bandwidth = 100 to 300kHz |
DurDT=200uS ReaT.=0.4mS Threshold=46dB Bandwidth=95 to 850 kHz |
15 | Clustering Felicity graph 3D location |
Results
Chassis (model A22&23)
There is evidence of AE ‘events’ along the cockpit beam bond-line in side view as shown in figure 5. This was unexpected as shown in figure 4, due to the inability of the FE model to predict this adhesive failure. The same is true for the diagonal line (figure 5) that follows the interface of the seat bulkhead to the chassis side face. This unexpected stiffness distribution caused higher than acceptable stresses in some areas.
During this test the FR is monitored at each load step (example shown in figure 6) and is a quantitative measure of how much further damage the structure is able to support, and with experience one can therefore use this to gauge at what load the structure will catastrophically fail (FR=0!). Test to analysis correlation is generally quite good, noting that patches of AE and FE colouration coincide.
The FR plot (figure 10) together with the location plots (figure 8&9 side and top views of a 3D location) highlighted the source and severity of the failure of the edge bond of the floor and the seat back during the squeeze test of chassis model A23.
The number of counts recorded during the test of a 2001 car (model A22) is in the order of 10 times more than the subsequent 2002 chassis test (80E5 versus 50E4). Therefore the knowledge gained in the earlier designs from the AE analysis were used to benefit subsequent designs.
Beam Wing (model A22)
Figure 12 shows PLAN view of wing test versus load.
After track use of this part, there was evidence of cracking around the bond-line at the interface of the wing to its mounting structure. Therefore a proof test was carried out to replicate the failure, and AE was used to locate and define the failure mechanism as shown in figure 13 where the FR falls to 0.8 at 100%, coinciding with location of the laminate peeling from the pylons. This allowed for the design to be amended in a way that improved the load distribution in the areas highlighted by the AE, and a re-test was carried out to verify that these alterations had the desired effect. Some ‘anti-peel’ mechanical fixings were added to the pylon interface to arrest this bond-line failure. Also the general laminate was thickened to reduce skin stresses at the radii of the raised central section, and therefore help prevent the spars from detaching from the upper wing surface.
Conclusion
Accumulation of AE test data over time allows for comparison between structures and a higher level of integration for problem fixes at the initial design stage in the future. This ‘database’ of knowledge can also be invaluable when attempting to decide what level of damage is acceptable for different structure types. More work is needed in the definition of acceptable FR values that are less than 1 for various component types and load scenarios. An example of which would be: what is an acceptable FR for a one-off loading (Impact test) versus low cycle fatigue (degrading FR with increasing number of load applications)?
That notwithstanding, if FR=1, there is far less chance of component failure.
In some cases, this quantification of problem areas allows for fixes to be made in time, and at lower cost, than would otherwise be possible.
Current understanding of levels of damage that are not evident in the external surfaces of CFRP structures used in Formula 1 is poor. There is potential for improvement in this area using some of the non-destructive evaluation techniques that have been discussed.
References
1 Rowland C. W., “Sound advice is the key to successful AE analysis” Materials World, October 2002, 26-27
2 Hamstad M. A., DownsK.S., “High sensor density acoustic emission monitoring of graphite/epoxy pressure vessels” Proceedings of Fifth International Symposium on Acoustic Emission from Composite Materials (AECM-5), Sundsvall, Sweden, The American Society for Non-destructive Testing, Inc., pp. 13-22, July 1995.
3 American Society for Testing and Materials, (ASTM) E1067, “Standard Practise for Acoustic Emission Examination of Fiberglass reinforced Plastic resin (FRP) Tanks and Vessels.” 2001
4 Taylor A., Gross S., Rowland C.W., Gregson P., “Monitoring Failure Mechanisms in CFRP Orthopaedic Implants during Fatigue Testing” EWGAE 2000 Paris
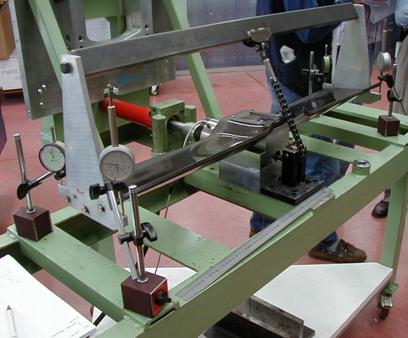
Figure 2 Showing a purpose built proof test rig for a down force wing
Figure 3 Showing a typical FR v load plots for problematic down force wings
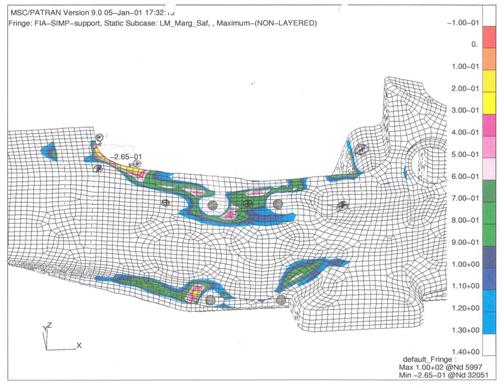
Figure 4 FE model at 200KN side squeeze load (A22 chassis)
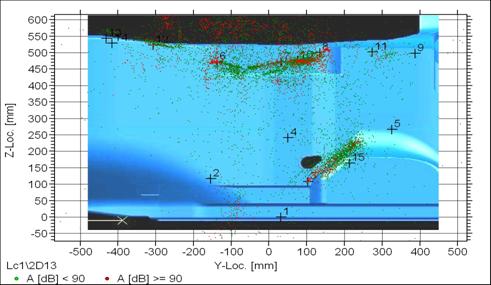
Figure 5 AE location (side view) at 200KN side squeeze load (A22 chassis)
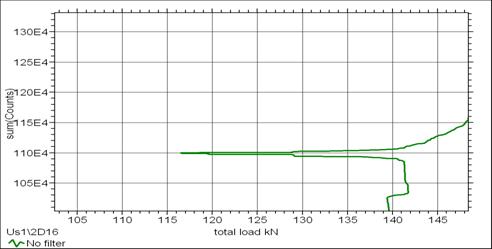
Figure 6 Felicity Ratio of 0.91 at 140KN side squeeze load (A22 chassis)
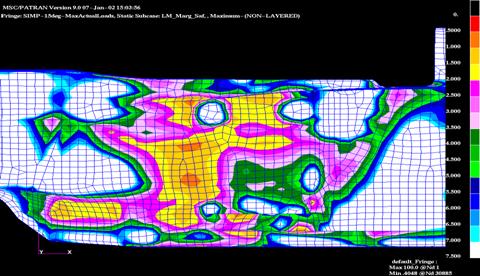
Figure 7 FE model at 200KN side squeeze load (A23 chassis)
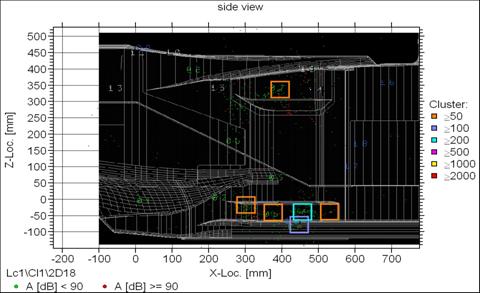
Figure 8 AE location at 170KN side squeeze load (A23 chassis)
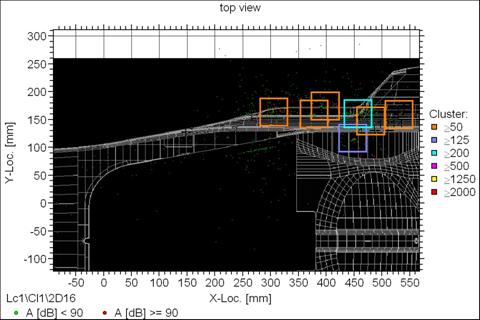
Figure 9 AE location at 170KN side squeeze load (A23 chassis)
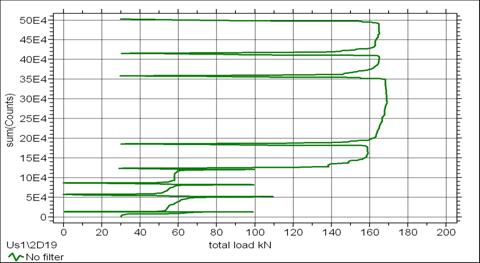
Figure 10 Felicity Ratio of 0.5 at 160KN side squeeze load (A23 chassis)
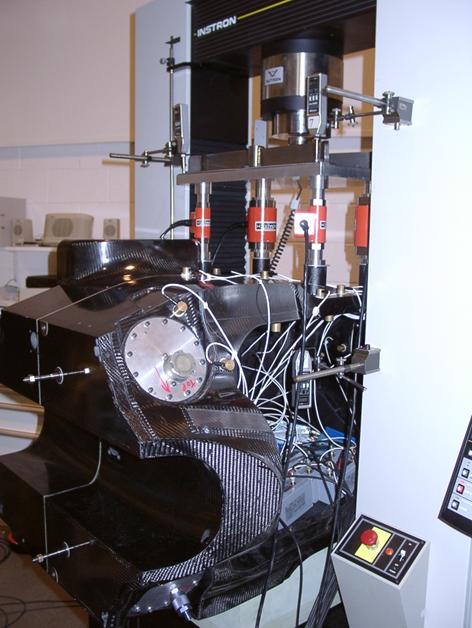
Figure 11 Showing A23 chassis in side static squeeze rig
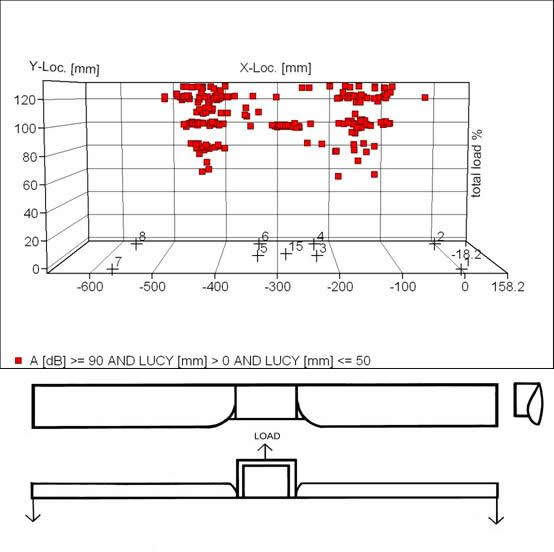
Figure 12 Showing AE location v load on A22’s beam wing + loading points
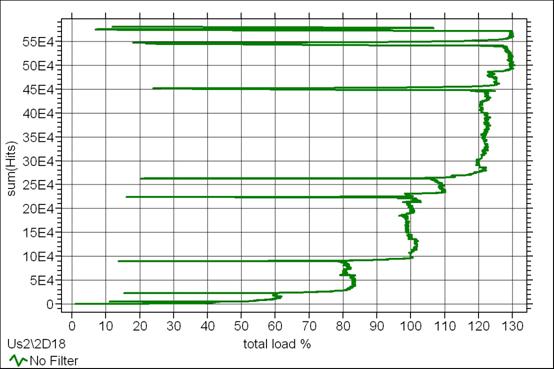
Figure 13 FR of 1 at 80%,0.8 at 100%,0.6 at 120%,0 at 130% load on A22’s beam wing